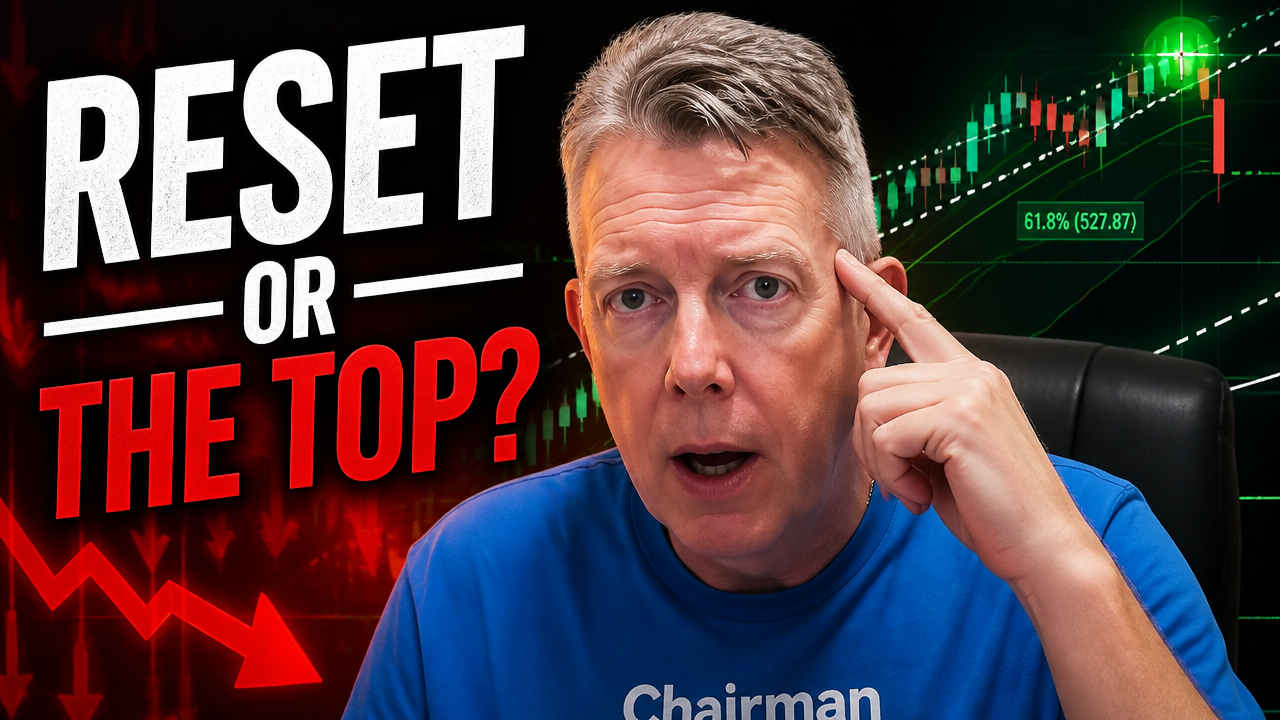
Friday was an absolute wake-up call for the broader markets. If you ended the final session of the week feeling a bit battered, you are not alone. We witnessed the S&P 500 lose 2.58%, the QQQ plunge nearly 5%, and the Semiconductor sector (SMH) take a massive 9.2% hit on the day.
It was a brutal session, but as a contrarian trader, this is exactly the kind of volatility we anticipate.
When a sector experiences a parabolic, euphoric runup, its leadership group—the very engine that drove the index to all-time highs—is invariably the group that takes it on the chin the hardest when the tide turns. As I always say: what takes weeks or months to build in terms of market gains can be taken away in a matter of days.
That is precisely why we do not chase stocks higher.
The Macro Forces Behind the Liquidity Drain
To understand if Friday’s correction is a temporary reset or a major macro top, we have to look past the red candles and evaluate the fundamental mechanics shifting behind the scenes. Several massive liquidity variables are converging simultaneously right now:
1. The SpaceX IPO Liquidity Vacuum
The highly anticipated SpaceX public offering is taking place, requiring an estimated $75 to $80 billion to fund. That capital has to come from somewhere. While a portion will bleed out of money market accounts, a significant chunk is being raised by institutions scaling out of their best-performing tech names to capture profits and rotate into SpaceX.
2. Corporate Share Buybacks Are Pausing
We are seeing structural shifts out of tech heavyweights like Meta, with unconfirmed reports indicating potential equity dilution to fund massive, multi-billion-dollar AI infrastructure buildouts. In an environment where free money from the Federal Reserve is gone, the era of companies borrowing cheap capital strictly to buy back their own shares is beginning to unwind. High-growth hyperscalers are pausing, and more supply of stock is hitting the market simultaneously.
3. The Threat of a New Interest Rate Regime
Three months ago, Wall Street was confidently pricing in a Federal Reserve rate cut for June. That narrative is completely dead. Following Friday’s hot jobs data, the bond and currency markets are signaling a new reality: the probability of an interest rate hike as soon as October is actively increasing. The last time we entered a rate-hiking regime was 2022—the genesis of the last major bear market.
The Smart Money Playbook for Monday Morning
So, how do we trade this setup?
First, let’s address amateur hour: thinking the entire multi-year bull run is dead because of a single bad Friday is a mistake. The macro path of least resistance technically remains higher until proven otherwise.
However, do not go shorting into weakness on Monday morning. There is nothing more dangerous than chasing a short into a major support floor; you will get caught in a ruthless counter-trend rally and get your face ripped off.
Instead, look at what the smart money is doing. Professional capital is sitting on its hands, waiting for structural support levels to get hit.
Smart Money Mindset
[Parabolic Peak]
                     \
                      \  (Friday Flush)
                       \
                        v
                 [Support Floor]
                       /
                      /  (Ruthless Counter-Trend Rally)
                     v
             [LOWER HIGH TARGET] <-- Where Smart Money Enters Shorts
                   \
                    \
                     v
             [Confirmation Breakdown]
The smart money strategy follows a strict conditional workflow:
- Allow the market to hit its baseline support floors (tracked cleanly via automated trendlines).
- Wait for the inevitable, sharp counter-trend bounce.
- Observe the retracement size of that bounce and ask one question: Do we print a lower high?
If the answer is yes, and it is followed by a confirmed breakdown below the Friday lows, that is when institutional capital will lean heavily into the short side. We don’t trade on hope or panic; we trade the setup.
Key Charts on the Watchlist
While we are maintaining profitable short positions on the overextended indexes (QQQ and SMH), the broader money flow is pointing directly toward non-tech value plays and defensive hedges.
Federated Hermes (FHI)
FHI provides a beautiful weekly bull flag setup. It broke out cleanly, completed a healthy backtest of previous resistance as new support, and caught immediate follow-through. While tech was getting absolutely slaughtered on Friday, FHI closed firmly green. We want to buy strength in value, not weakness in overhyped tech.
General Motors (GM)
GM has shown up on our structural screeners after building a massive, multi-month rounding base on the monthly chart. Currently, we have a tight Bollinger Band squeeze forming inside the Keltner channels on the weekly chart. Tight consolidations like this resolve violently, and because the underlying macro trend here is bullish, the probability is heavily weighted toward an explosive breakout to the upside.
Direxion Daily Gold Miners Bear 3X (DUST)
Friday’s strong economic data spiked both the US Dollar and Treasury yields. As long as the dollar and yields are ripping higher together, gold, silver, and gold mining equities will perform poorly. We avoid those names like the plague right now and utilize DUST as a highly efficient, leveraged vehicle to profit from the downside correction in precious metals.
Take the Emotion Out of Your Trading
If you want to survive volatile structural shifts like this, you must establish a mechanical game plan before the opening bell rings.
All of our exact entry zones, protective stop-loss parameters, and macro price targets for FHI, GM, and DUST have already been uploaded directly inside the Contrarian Trader Member Area.
- Want a risk-free look behind the curtain? Take a free tour of our community platform to view our premium setups with absolutely no credit card required.
- Want the exact charting tools used in this brief? We partner directly with TrendSpider to give our audience an exclusive look at the markets. Grab a 14-Day Pass to TrendSpider for just $9.00 here, or unlock it completely free by upgrading to our premium Gold or Titanium community levels.
Keep your capital preserved, stay patient, and let the setups come to you.
Be well.
For a masterclass on how to technically spot sudden, volatile market reversals before they catch the retail crowd off guard, you can watch The Market Mechanics Blueprint: Trading Beyond the Chart Lines This presentation breaks down how complacency traps bulls and bears alike, offering clear rules on how to safely identify macro turning points.
Start Your Trading Journey Today
Get free access to weekly swing trade setups, market analysis, and our community of traders.

Related Articles
Macro Contrarian Case Study: Anatomy of the Semiconductor Short Trade
True contrarian trading is not about blindly fading a strong trend or trying to guess...
 Education
QQQ Trade Review: Navigating Market Structure
When the Nasdaq is aggressively grinding higher and retail traders are blindly chasing the trend,...
 Education
The Post-Market Sprint July 14, 2026
If you want to bypass the noise and sit in on our live, member-only execution...
 Education
The 500% AI Trading Boom: Why Black-Box Stock Pickers Are Leaving Retail Traders Broke
The data doesn’t lie. Search interest for automated AI trading tools is up over 500%....