
These 5 Stock Charts Are About to Explode | Watch This Setup
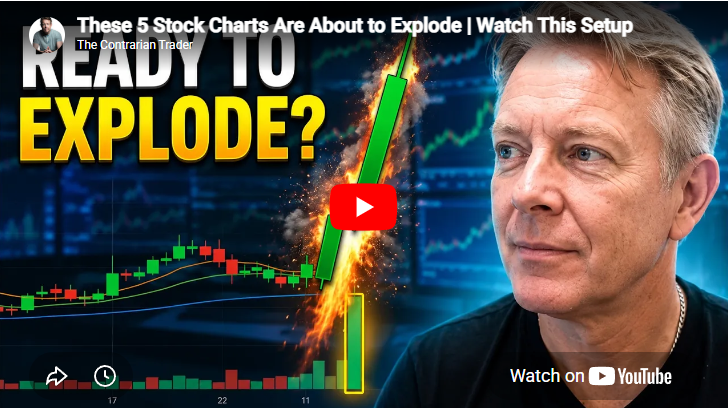
📺 Watch The Full Video Analysis
Why Sector Rotation Matters Right Now
One of the most important themes developing beneath the surface of this market is sector rotation.
While many investors remain hyper-focused on AI stocks and mega-cap technology names, the charts are beginning to suggest that capital may be rotating into:
- Financials
- Industrials
- Payroll services
- Consumer-related stocks
- Select cyclical value plays
That doesn’t necessarily mean technology is dead.
It means the market may be broadening.
And historically, broadening participation is often healthier than rallies driven by only a handful of stocks.
The Technical Setup We’re Watching
Several of the stocks featured this week emerged from a Bollinger Band Squeeze scan using TrendSpider.
For traders unfamiliar with the setup:
A Bollinger Band Squeeze occurs when the Bollinger Bands compress inside the Keltner Channels, signaling an unusually tight consolidation period. This often leads to a significant expansion in volatility once price breaks out of the range.
In simple terms:
Compression leads to expansion.
The key is determining whether that expansion resolves bullishly or bearishly.
QBTS (D-Wave Quantum): High Risk, High Volatility Momentum
QBTS remains one of the more speculative charts on the watchlist.
This is not a value investment.
This is a momentum-driven, technically focused swing trade setup tied to the quantum computing theme. The stock has a small float, high volatility, and strong news sensitivity.
Technically, the chart recently broke out of a multi-month consolidation pattern before accelerating sharply higher. The setup now appears extended short term, but an orderly pullback toward support could create a new swing trading opportunity.
This is the type of setup where risk management matters more than prediction.
Financials Are Quietly Firming Up
One of the more interesting developments this week is the improving technical condition of financial stocks.
Cincinnati Financial (CINF) and the Financial Select Sector SPDR Fund (XLF) both displayed strong bullish behavior on the weekly timeframe.
Why this matters:
Financials often benefit from rising interest rates due to expanding net interest margins and stronger investment income. Insurance companies and banks can both benefit in this environment.
The charts suggest institutional money may already be rotating into the group.
Alcoa (AA): A Global Growth Tell
Alcoa is acting like a market tell.
Despite rising oil prices — which normally pressure aluminum producers through higher energy costs — the stock continues to show technical strength.
That resilience may suggest:
- The market expects energy prices to stabilize
- Global growth expectations remain intact
- Commodity-related demand may remain stronger than feared
The chart recently resolved higher from another Bollinger Band Squeeze setup, and traders are now watching for an orderly retracement before potential long entries.
Paychex (PAYX): Quiet Value Rotation
Paychex may be one of the more important charts discussed this week.
Unlike the speculative momentum names, PAYX represents a more conservative value-oriented setup tied to payroll services and small business activity.
Technically, the stock recently broke out after a long-term downtrend and may be entering an entirely new recovery phase.
This is exactly the type of stock that tends to attract capital during periods of market broadening and sector rotation.
Autodesk (ADSK): A Longer-Term Opportunity?
Autodesk may be one of the cleaner technical setups on the board.
The stock has spent nearly two years consolidating inside a broad trading range while valuation conditions improved significantly.
Now:
- Weekly support is holding
- Volatility compression is tightening
- A new Bollinger Band Squeeze has emerged
- Risk/reward conditions appear favorable
For swing traders and position traders alike, ADSK may represent one of the more attractive risk-adjusted opportunities discussed this week.
What Traders Should Watch Next Week
The key question now becomes:
Is this the beginning of a larger market rotation?
If financials, industrials, value stocks, and cyclical sectors continue to strengthen while mega-cap leadership cools, traders may need to adjust positioning accordingly.
That’s why this week’s charts matter.
Not because they guarantee outcomes.
But because they reveal where probabilities may be shifting.
And successful traders focus on probabilities — not predictions.
Join The Contrarian Trader Community
Members of The Contrarian Trader receive:
- Real-time trade alerts
- Weekly market analysis
- TrendSpider-powered technical scans
- Entry points, stop-loss levels, and price targets
- Sunday Night Futures LIVE
- Market Wrap commentary
- Educational swing trading analysis
Gold and Titanium members also receive TrendSpider access as part of membership.
👉 Start with the Free Membership
No credit card required.
Start Your Trading Journey Today
Get free access to weekly swing trade setups, market analysis, and our community of traders.

Related Articles
 Equity Research / Stock Analysis
Best Stock Charts Deep DIVE!
👉 14 Days of Gold Access for $9Includes real-time trade alerts, private Slack access, Market...
 Equity Research / Stock Analysis
Rising Bond Yields Threaten the Semiconductor Trade: 6 Rotational Stock Setups to Watch This Week
The Macro Threat: Rising Yields and the Semiconductor PressureFor the past year, semiconductor and high-growth...
 Equity Research / Stock Analysis
Is Nike Stock Finally A Buy? The Truth Behind The Sell-Off
Nike stock has been crushed from its highs, and for good reason. The company has...
 Equity Research / Stock Analysis
Beyond the MAG 7: Why Institutional Money Is Rotating Into Unloved Sectors
Driving down to Washington D.C. in eight hours of nightmare traffic gave me plenty of...