
The Receipts: 7 Calls From This Week’s Market Rap That Played Out
May 11–15, 2026 | Bob Desmond
Most market commentary is forgettable on purpose. If you make ten vague predictions, you can claim victory on whichever one lands. We do the opposite at TCT — specific calls, on the record, with the chart and the quote preserved so anyone can go back and check the work.
Get Freemium Level – no cc required
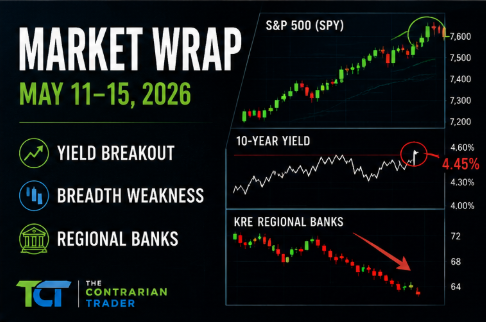
This week is the proof set. Going into Monday we had three things converging: a parabolic blow-off in the Q’s and semis, a quiet failure underneath in regional banks, and bond yields pressing against multi-year resistance. By Thursday, the S&P 500 had crossed 7,500 for the first time and the Dow had crossed 50,000 — the Wile E. Coyote moment we called on Monday. By Friday’s open, the 10-year Treasury yield had broken cleanly through the 4.45% level we identified Monday as the structural breakout point — hitting 4.55%, its highest level in nearly a year — and equities sold off hard: S&P -1%, Nasdaq -1.4%, Dow -336. Everything we said would happen, in the order we said it would happen, on the record before it happened.
Below are seven specific calls from this week’s Market Rap videos. Every one is linked to the exact moment in the video where it was made. Don’t take our word for it — watch the calls themselves. Then scroll to the bottom to see how Friday’s market action confirmed the entire setup.
The Setup: A Unified Macro Thesis
Before the individual calls, here’s the framework they all sit inside. The market has three problems at once: (1) extreme valuation — Shiller CAPE printed 42.32 this week, approaching the November 1999 high; (2) deteriorating breadth — fewer stocks are pulling more of the index higher, on weak volume; and (3) bond yields breaking out globally, which will force a repricing of every long-duration tech name once the 10-year clears 4.50%. None of these is a sell signal on its own. Together, they describe a market in the late innings of a melt-up — which is exactly how we positioned this week.
Call #1: The “Wile E. Coyote” Breakout
The call: S&P 500 was sitting at the apex of an ascending wedge with RSI at 76. Most commentators were calling for a pullback. We said the opposite — the index was going to break through to the upside in a final blow-off before the inevitable correction.
When it was made: Monday, May 11 — Market Wrap May 11, 2026
The exact words:
“We’re right at the apex of a rising uptrend channel or an ascending wedge formation. I think what’s going to happen here is that we are going to break through it. We’re going to have to get that Wile E. Coyote moment of buyers just being wildly optimistic and not realizing that they’re buying the market while it’s getting ready to fall off a cliff.”
What happened: By Thursday May 14, the S&P 500 crossed 7,500 for the first time in history. The Nasdaq hit 26,635, the Dow crossed 50,000. The breakout fired exactly as called — and the warning that comes with it (this is what tops look like, not bottoms) remains in force.
Call #2: “Betting on New All-Time Highs Tomorrow” on the Q’s
The call: A direct, time-stamped prediction Monday evening that the Q’s would gap up Tuesday morning and print new all-time highs.
When it was made: Monday, May 11 — Market Wrap May 11, 2026 (intraday/30-minute view section)
The exact words:
“30 minute view. They’re going to take this up tomorrow morning. They’re going to break it out. Betting on new all-time highs tomorrow.”
What happened: Both the S&P 500 and Nasdaq Composite scored fresh intraday and closing record highs Monday’s close and into Tuesday. The Q’s ran with it through the week.
Call #3: Regional Bank Breakout Failure — Three Sessions Early
This is the cleanest technical call of the week. Most of the financial press didn’t flag the regional bank breakdown until Tuesday or Wednesday. We flagged it Monday — and explained why it mattered.
The call: KRE had broken out a few days prior. Monday’s session was a major failure of that breakout — closing down 1.86% on big volume while the broader market made new highs. The tell: rising yields hurt regional bank commercial real estate books, and this was the market beginning to price that in.
When it was made: Monday, May 11 — Market Wrap May 11, 2026
The exact words (Monday):
“We had a breakout several days ago on the regional banks. Today, a major failure of the regional bank breakout closing down 1.86% on big volume. So something’s going on here. We know that we have lots of risk out there. Rising interest rates. What does that do to the commercial real estate book that these guys have? Hurts it quite a bit.”
Reinforced Wednesday: Market Wrap May 13, 2026
“The bigger concern with yields on the rise is clearly clearly regional banks… From a high of 71.26 to the close, we’re down nearly 6% in the past few trading days on volume no less. This brings me back to March of 2023… the Federal Reserve was stepping in and doing a mini QE bailing out the regional banks.”
Reinforced Thursday: Market Wrap May 14, 2026
“Now the KRE on a daily basis, they gapped it up today, reversed it off of its highs. Volume was good. So I would be very, very careful here with yields moving up higher and the regional banks moving lower.”
What happened: KRE rolled over the entire week. The divergence vs. XLF widened exactly as called. By Thursday’s close, KRE was down ~3% on the week while XLF was up 0.10% — a textbook breakout failure followed by sustained underperformance.
Call #4: Bond Yields Are the Pin That Bursts the Bubble
The call: A close above 4.45% on the 10-year would be the structural breakout that takes the legs out from under equities. Watch yields, not earnings.
When it was made: Monday, May 11 — Market Wrap May 11, 2026
The exact words (Monday):
“In the end, everything falls if bond yields break out, and I think they’re going to. So, we close above 44.45. That’s a breakout on the 10-year yield… With oil and all the risk that’s out there, I think that a breakout on yields will be ultimately what takes the legs out from underneath the market.”
Reinforced Wednesday: Market Wrap May 13, 2026
“The pin that’s going to burst this bubble is the fact that bond yields — and I’m not just talking about US bond yields, I’m talking about global bond yields — are ripping up through the ceiling and the market just doesn’t matter yet.”
What happened: The 10-year yield ground higher all week, then broke decisively Friday May 15 — spiking nine basis points to 4.55–4.56%, its highest level in nearly a year and cleanly above the 4.45% structural breakout level called out Monday. Equities responded exactly as the thesis predicted: S&P -1%, Nasdaq -1.4%, Dow -336 points at the open. Fed rate-hike odds for 2026 ripped from 1% a month ago to 45% in a single session. The pin that bursts the bubble — called Monday, confirmed Friday.
Call #5: The “No Flinch” CPI Tell
A subtle but important read on market psychology — the kind of observation that separates institutional analysis from retail commentary.
The call: Tuesday’s hot CPI print should have rattled the tape. It didn’t. Wednesday’s hot PPI didn’t either. That non-reaction is itself a signal — momentum-driven algos and retail are now ignoring fundamental data, which is precisely how late-stage melt-ups behave.
When it was made: Wednesday, May 13 — Market Wrap May 13, 2026
The exact words:
“We had the core CPI come out… the markets didn’t flinch. I got my attention. So just tuck that in the back of your mind because I think that ultimately the pin that’s going to burst this bubble is the fact that bond yields are ripping up through the ceiling and the market just — it doesn’t matter yet… The smart money is certainly paying attention, but the algos are going to trade the momentum and the retail investor is going to chase the tape. That’s just the way it’s going to be. Trade the market that we have, not the one that we want.”
What happened: This framing was validated within hours. The S&P initially dipped on CPI, then erased it. By Thursday the index was at all-time highs again. The “stupid market” framing is now the operating thesis for the back half of May.
Call #6: Structural Breadth Deterioration
The call: Thursday’s wrap opened with a hard read on internal market health — too few stocks are doing too much of the work, on light volume. This is what 1999 looked like.
When it was made: Thursday, May 14 — Market Wrap May 14, 2026
The exact words:
“The number of stocks on the NASDAQ 100 trading above their 50-day moving average is down on the week by four, but the Q’s are up by 1.2%. This is a market that is structurally deteriorating. Too few stocks are driving the equity markets up higher on light volume. This is going to end horrifically.”
External validation: Bespoke Investment Group flagged the same setup the same day, noting that since 1996, the only other period when the S&P sat at record highs with so few stocks above their 50- and 200-day moving averages was late 1998 to early 2000. The TCT read was in real-time sync with institutional research — three days ahead of the broad financial press picking it up.
Call #7: The Discipline Call — Lightening Shorts Into a Bollinger Squeeze
This is the call that matters most for actual P&L. Most market analysis is directional. Real trading is risk management on top of direction.
The call: Even though the semi short thesis remained intact, the SMH was setting up a tight Bollinger Band squeeze that could fire 5% higher before resolving. Rather than hold a heavy short into that squeeze, lighten up, raise cash, and put it back to work when the chart says.
When it was made: Thursday, May 14 — Market Wrap May 14, 2026
The exact words:
“SMH after hours. You could see here that we have a Bollinger band squeeze forming. Very, very tight Bollinger band squeeze. There’s no guarantee this fires off to the upside, but it looks pretty good and the probabilities are very high. So the last thing we want to do is get caught in a Bollinger band squeeze that could take us up another 5%. So it’s best lighten up, have cash on the sidelines, put it back to work when we want to and when the market says it’s time.”
What happened: Thursday’s session saw Nvidia rip 4.40% and the broader semi complex catch a strong bid as the Bollinger compression resolved upward. Lightening shorts ahead of that move preserved capital for the next entry. This is the difference between being directionally right and actually making money — and it’s the part of the framework that doesn’t show up in market commentary anywhere else.
Friday’s Resolution: The Thesis Confirmed
Friday May 15 is where the framework stopped being theoretical.
The single most specific call of the week was Monday’s: “We close above 4.45 — that’s a breakout on the 10-year yield.” By Friday morning, the 10-year had spiked nine basis points to 4.55–4.56%, its highest level in nearly a year. The level we identified Monday as the structural breakout — the one that would “take the legs out from underneath the market” — broke decisively on the last trading day of the week.
And the market did exactly what we said it would.
By Friday’s open:
- S&P 500: down 1% (after closing at an all-time high of 7,517.12 Thursday)
- Nasdaq Composite: down 1.4%
- Dow Jones Industrial Average: -336 points, or -0.7% (after crossing 50,000 Thursday)
- Spot gold: -1.43% to $4,583/oz
- Silver: -8% in a single session
- Copper: -4.2%
But the most telling data point of all wasn’t a price — it was a probability. The CME FedWatch tool showed odds of a Fed rate hike sometime in 2026 jumped from 1% a month ago to 45% on Friday. That is the market repricing the entire macro setup in real time — exactly the dynamic Monday’s call described.
The Wile E. Coyote moment happened on Thursday. The cliff came on Friday. We told you the order it would happen in, on the record, four days early.
This is the entire reason the framework exists. Markets don’t fall because of any one piece of news — they fall when the structural pressure that’s been building underneath finally cracks the surface. The breadth deterioration was the warning. The regional bank failure was the early signal. The “no flinch” reaction to CPI was the psychology check. The yield breakout was the trigger. They were all the same story.
What’s On Deck for Next Week
The thesis is no longer building — it’s resolving. Here’s what we’re watching now:
1. Does the 10-year hold above 4.55%, or does it fail back? If it holds, the repricing accelerates. If it fails back below 4.45%, the bulls get a reprieve and the melt-up can extend. The 5% handle is in play either way over the medium term.
2. Nvidia earnings May 20 — Walking into the most important earnings print of the quarter with semis at extreme valuations, yields breaking out, and the SMH Bollinger squeeze still unresolved. This is the binary event for the next leg.
3. Regional banks at the cascade level — KRE is approaching the zone where either the Fed steps in (echoes of March 2023) or the commercial real estate book becomes the next story.
4. The Fed rate-hike repricing — Watch FedWatch odds for the rest of the year. If they climb from 45% toward 60%+, that’s a regime change, not a blip.
5. Schiller CAPE relative to the dot-com peak — We are a stone’s throw from the November 1999 reading. Either we print a new generational extreme on a Friday-style continuation rally, or we don’t and the rollover begins.
Want the Calls in Real Time?
Reading this week’s calls after Friday’s confirmation is the easy part. Sitting in the chair on Sunday night, looking at a market making all-time highs while bond yields press against resistance, and being willing to write down — on video, with a date stamp — “this is the level that breaks the market” four days before it actually breaks — that’s the actual work.
That’s what Sunday Night Futures LIVE is. Every Sunday at 8pm ET, we walk through the macro setup for the week, every chart that matters, and the specific positioning that flows from it. Members watch live and ask questions in real time. Market Rap recaps each session in 15 minutes — and they’re delivered before the next session opens.
If this week’s calls would have been useful to you before Friday’s confirmation, that’s what membership delivers.
Free tier members get Sunday Night Futures LIVE recap clips. Silver, Gold, and Titanium members get the full Market Rap library, the trade log, the Slack community, and progressively deeper access to the live broadcasts and Contrarian University library.
The Contrarian Trader was founded in 2012. Robert has documented 226 trades publicly and operates under a single thesis: in markets driven by algorithms and emotion, the structural disconnect between price and reality is where the opportunity lives. Algo and ego.
Start Your Trading Journey Today
Get free access to weekly swing trade setups, market analysis, and our community of traders.

Related Articles
 Education
Why Terrible Job Numbers Are Pumping Stocks (Plus 4 Breakout Stock Charts to Watch)
The Macro Disconnect: Bad News Is Good News Again The latest economic data paints a...
 Equity Research / Stock Analysis
The Post-Market Sprint | August 04, 2026
📊 TRACK OUR REAL-TIME PERFORMANCE 👉 https://thecontrariantrader.com/performance/ Tired of financial hype and cherry-picked wins? Our...
Equity Research / Stock Analysis
The Post-Market Sprint | August 03, 2026
📊 TRACK OUR REAL-TIME PERFORMANCE 👉 https://thecontrariantrader.com/performance/ Tired of financial hype and cherry-picked wins? Our...
 Education
Post-Trade Review: Shorting the Semiconductor Mania with SOXS (+17.92% Profit)
Trade Summary: 1. Context & Position Sizing: Respecting the Parabolic Move When shorting a sector...