
Stock Market Breadth Warning: Why the S&P 500 Looks Stronger Than It Is
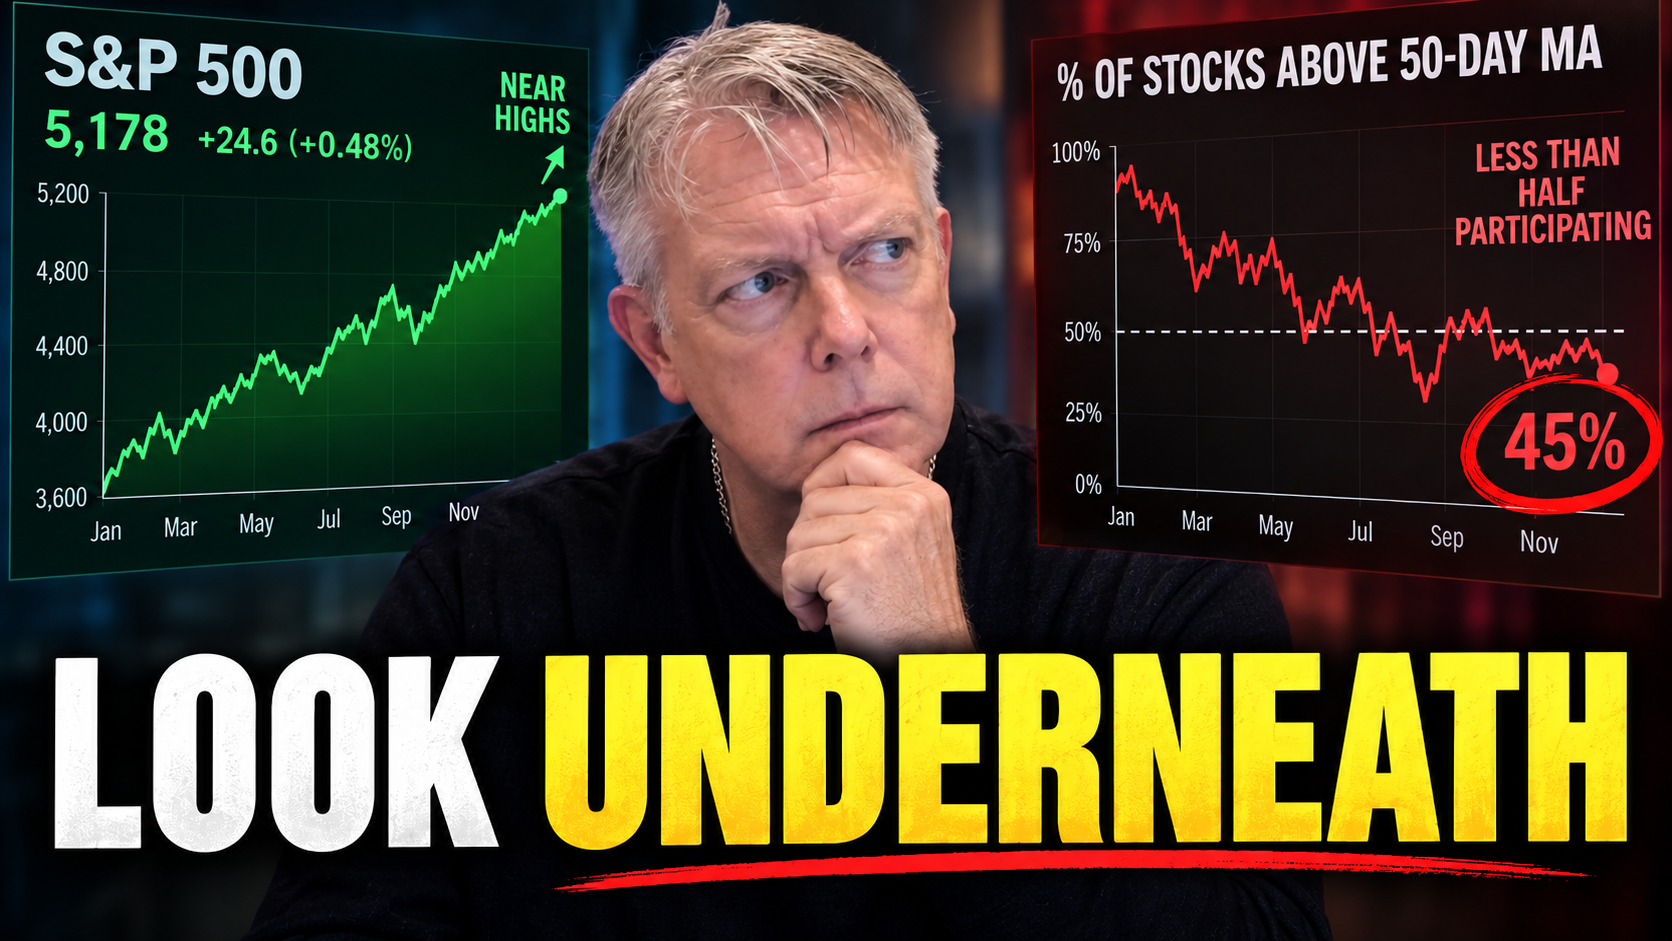
That sounds bullish.
But there is a problem. Stock market breadth!
When you look underneath the S&P 500 and Nasdaq, the picture is considerably weaker than the headline indexes suggest.
That may be one of the most important signals investors and swing traders should be watching as we enter the new trading week.
The S&P 500 finished last week slightly higher, while the equal-weighted S&P 500 moved lower. The same divergence was even more pronounced in the Nasdaq, where the capitalization-weighted QQQ outperformed its equal-weight counterpart by a wide margin.
Meanwhile, fewer than half the stocks in both the S&P 500 and Nasdaq 100 were trading above their 50-day moving averages.
That is not what healthy market participation normally looks like.
And it raises an important question:
Are investors watching the indexes when they should be looking underneath them?
That is what we are going to examine in this Week Ahead Commentary.
What Is Market Breadth?
Market breadth measures how many individual stocks are participating in a market move.
This matters because the S&P 500 and Nasdaq are capitalization-weighted indexes.
A relatively small number of very large companies can have an outsized influence on the performance of the overall index.
As a result, the index can rise even while a substantial percentage of its underlying stocks are falling or struggling.
That is why we do not simply look at the S&P 500 and conclude:
The index is up, therefore the market is healthy.
We want to know how many stocks are actually participating.
That is where market breadth becomes valuable.
Fewer Than Half of S&P 500 Stocks Are Above Their 50-Day Moving Average
One of the charts that concerns me most going into the new trading week is the percentage of S&P 500 stocks trading above their 50-day moving averages.
That figure has fallen below 50%.
Just a few weeks earlier, participation was considerably stronger.
This is important because a rising market supported by a large percentage of its component stocks is generally healthier than a market being carried by a shrinking number of large-cap names.
The same problem is appearing in the Nasdaq 100.
Only about 45% of Nasdaq 100 stocks were trading above their 50-day moving averages in the analysis reviewed for this week’s commentary.
That is the market telling us something.
The headline index may look fine.
The stocks underneath it are not nearly as healthy.
SPY vs. RSP: The Market-Cap Weighting Problem
Another way to see this divergence is by comparing the market-cap-weighted S&P 500 ETF, SPY, with the equal-weighted S&P 500 ETF, RSP.
SPY finished the week slightly higher.
RSP declined.
Why does that matter?
Because RSP gives every company in the S&P 500 approximately the same influence.
SPY does not.
In SPY, the largest companies have much greater weight.
Therefore, when SPY rises while RSP falls, it can indicate that a relatively small group of mega-cap stocks is doing much of the heavy lifting.
That is exactly the type of environment where traders need to become more selective.
The Nasdaq Divergence Is Even More Striking
The Nasdaq presents an even more dramatic example.
The QQQ finished higher for the week, but the equal-weighted Nasdaq basket fell significantly.
In the commentary, QQQ was up roughly 0.35% while the equal-weighted Nasdaq basket was down roughly 2.53%.
Think about that for a moment.
The index is green.
The average stock inside that universe is behaving much worse.
This is why I continue to say:
All stocks are not made equal in this market.
If you are swing trading, simply buying something because “the Nasdaq is strong” is not enough.
You need to know where money is actually flowing.
Why the Week Ahead Could Be Important
Market breadth is not the only issue traders need to watch.
We also have important inflation data approaching.
The Producer Price Index, or PPI, and Consumer Price Index, or CPI, could influence expectations for Federal Reserve policy and Treasury yields.
The greater issue is not necessarily one individual rate decision.
It is whether the market is beginning to price in a new interest-rate regime.
Markets can often absorb a single rate move.
A sustained trend in rates is another matter.
That can affect:
- Equity valuations
- Growth stocks
- Semiconductor stocks
- Banks
- Gold
- The U.S. dollar
- Treasury bonds
- Small-cap stocks
This becomes especially important when stock market valuations are already elevated.
Commodities Are Sending Another Inflation Signal
One of the more concerning charts in this week’s analysis is the CRB Commodity Index.
Commodity prices have moved to levels that require looking back many years for comparable readings.
That matters because rising commodity prices can feed inflation.
If inflation remains persistent, long-term Treasury yields may need to remain higher.
And higher long-term yields create competition for equities while increasing the discount rate applied to future corporate earnings.
For richly valued areas of the market, that is not trivial.
Watch the Dow Transports
The Dow Jones Transportation Average is another chart worth watching closely.
The transports recently broke support before recovering back above it.
But another meaningful breakdown could become a significant warning for the broader equity market.
Why?
Because transportation stocks provide insight into the movement of goods throughout the economy.
If the major industrial averages remain strong while transports weaken materially, it can become an important divergence.
The approximate level highlighted in this week’s commentary was 20,807.
A sustained break beneath that area would deserve attention.
Semiconductor Stocks: Bullish Price Action, Questionable Momentum
Semiconductors remain one of the most important groups in the market.
The sector displayed some constructive technical characteristics last week.
There was a breakout attempt.
There was also a bullish reversal.
But momentum is not giving us an entirely clean signal.
Slow stochastics remain below the 50 level with both lines declining.
Historically, that type of setup can make rallies more vulnerable to failure.
That does not mean semiconductor stocks must fall.
It means traders should not confuse a bullish price candle with confirmation from every underlying technical indicator.
The test comes at resistance.
Can semiconductors break out and hold?
Or does momentum begin to matter?
That could be one of the defining questions of the week.
Micron Is Showing Relative Strength
Micron Technology stands out within the semiconductor group.
The stock had a strong week following impressive earnings and guidance.
The price action is constructive.
But again, the real test is whether the stock can break through prior highs and sustain that breakout.
That is the difference between a stock that is simply bouncing and a stock entering a new bullish phase.
For swing traders, that distinction matters.
Software Remains Constructive
Software stocks also deserve attention.
The group recently broke out and then successfully retested that breakout area.
That is generally constructive technical behavior.
The weakness is volume.
A stronger expansion in volume would provide additional confirmation.
Still, compared with several other areas of the equity market, software is behaving relatively well.
Emerging Markets Could Benefit From Dollar Weakness
Emerging markets are another area showing improving technical characteristics.
A weaker U.S. dollar could provide additional support.
South Korea remains particularly interesting because of its heavy semiconductor exposure.
Brazil also has a constructive long-term chart.
Currency movements will play an important role here.
If the dollar weakens meaningfully, emerging-market equities could become increasingly attractive on a relative basis.
Oil Has Broken Out
Crude oil also deserves attention after a significant breakout.
The next question is whether previous resistance becomes support.
Approximately $87.50 is an important technical area to watch based on this week’s chart analysis.
If crude remains strong, it complicates the inflation narrative.
Higher oil prices can add inflationary pressure at exactly the time markets are attempting to determine how aggressive the Federal Reserve may need to become.
Gold Faces an Interest-Rate Test
Gold is also approaching an important macro crossroads.
Gold can perform well during periods of inflation.
However, if investors believe the Federal Reserve is successfully getting ahead of inflation by raising interest rates, gold may struggle.
The more bullish scenario for gold would be persistent inflation accompanied by a central bank unwilling or unable to tighten policy sufficiently.
That makes upcoming inflation data especially important for precious metals investors.
The Bigger Message: Stop Watching Only the Index
The most important lesson from this week’s analysis is not whether the S&P 500 finishes Monday higher or lower.
It is this:
A headline index can hide substantial weakness underneath the surface.
When fewer stocks are participating, traders need to become increasingly selective.
That means paying attention to:
- Market breadth
- Equal-weighted indexes
- Relative strength
- Sector rotation
- Momentum
- Volume
- Interest rates
- Intermarket relationships
This is where technical analysis becomes much more valuable than simply watching whether the S&P 500 is green or red on any given day.
The market is telling multiple stories at the same time.
Our job is to determine which one matters.
What Members Receive
The public Week Ahead Commentary focuses on the broader market environment:
Market breadth.
Macro trends.
Sector analysis.
Technical levels.
Risk.
Opportunity.
Members of The Contrarian Trader receive the execution layer.
That includes our actual positions, trade management, real-time trade alerts and Best Stock Charts for the New Trading Week.
Because understanding what the market is doing is one thing.
Knowing what you are going to do about it is another.
Start Your Trading Journey Today
Get free access to weekly swing trade setups, market analysis, and our community of traders.

Related Articles
 Equity Research / Stock Analysis
Tesla Earnings Analysis: Hype in META, Opportunity in NFLX?
META, Tesla (TSLA), and SpaceX (SPCX) are grabbing the earnings headlines. So why did I...
 Equity Research / Stock Analysis
SPCX, NFLX & NLY Earnings Review: Opportunity—or an Earnings Trap?
Strong earnings. Falling stocks. A dividend yield that demands a closer look. This SPCX, NFLX...
 Equity Research / Stock Analysis
Stocks Falling After Earnings: Is This a Market Warning?
Good earnings. An early rally. Then the sellers arrive. Stocks falling after earnings deserve attention—especially...
 Equity Research / Stock Analysis
KARO Stock After Earnings: Buy the Dip—or Walk Into a Trap?
Good earnings should send a stock higher. What happens when sellers have other plans? That’s...